
Consulting’s AI-Driven Dip: Value Trap or Value Gap?
Six listed consulting and advisory firms. One sector discount. Different positions on AI. A stage-by-stage look at who is adapting.

The setup
Consulting firms are trading at a steep discount to their own history. Trailing P/E are 40% below the 5 year average, the deepest discount in over a decade. Since big management consulting firms are not publicly listed, my core focus is on Booz Allen Hamilton (BAH), Accenture (ACN) and Capgemini (CAP). For data and comparison purposes I added Cognizant, Infosys and Gartner. These are not traditional consulting firms, but they share enough similarities to be useful for the comparison.

The cause of the valuation drop is not in dispute. AI has been repriced into the sector as a structural threat. Large language models and agentic tools automate work consultants used to charge hourly for, so revenue compresses, margins compress, and the business model breaks. The market has acted on that narrative.
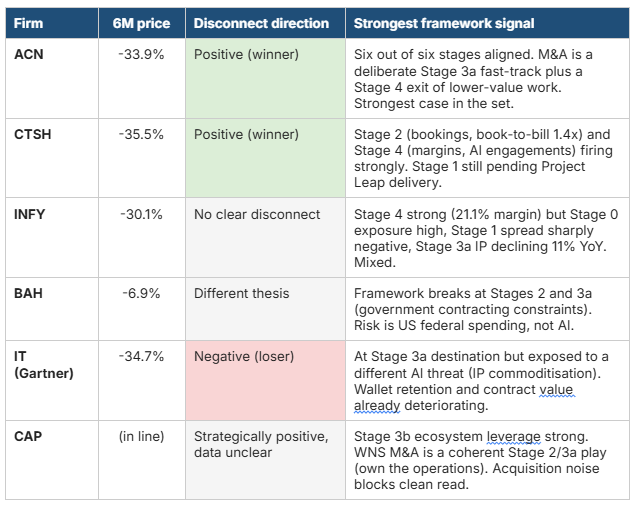
Share price drops over the past six months:
Accenture (ACN): down 34%
Cognizant (CTSH): down 36%
Infosys (INFY): down 30%
Gartner (IT): down 35%
Capgemini (CAP): down 27%
Booz Allen Hamilton (BAH): down 7%, the outlier
The question is not whether AI is a real threat. It is. The question is whether the market has applied the discount uniformly to firms positioned very differently against that threat and whether the strategic reaction is starting to show a positive impact. That is the value gap question.
This article works through six firms on a stage-by-stage framework to find where the data clearly supports a winner or loser narrative. The goal is identification.
How AI actually impacts consulting
Three things happen at the same time when generative AI hits a consulting firm. They do not affect every firm in the same way and they do not move on the same timeline.
1. Routine work gets automated first
Research, slide drafting, data cleaning, code generation, and basic analysis are the tasks AI does well today. In most large firms these are billed at junior rates. As internal AI tools take over this layer, labour per project falls. If pricing is per hour, revenue falls with it. If pricing is per outcome or per subscription, the firm keeps the productivity gain.
2. Commercial models come under pressure
Clients are aware AI is reducing the cost of consulting delivery. They are demanding the savings back, either through lower fees or outcome-based contracts. Firms that move to fixed-price or outcome-based pricing keep more of the AI productivity. Firms locked into time-and-materials contracts give it away.
3. The IP layer becomes the new moat
If labour becomes commoditised by AI, value moves to what cannot be commoditised: proprietary data, trained models, industry-specific platforms, deep client relationships, judgement on high-stakes decisions. Firms that have invested in productising their expertise into software, platforms, or licensable IP have something AI cannot easily replicate. Firms that have not are exposed.
The framework
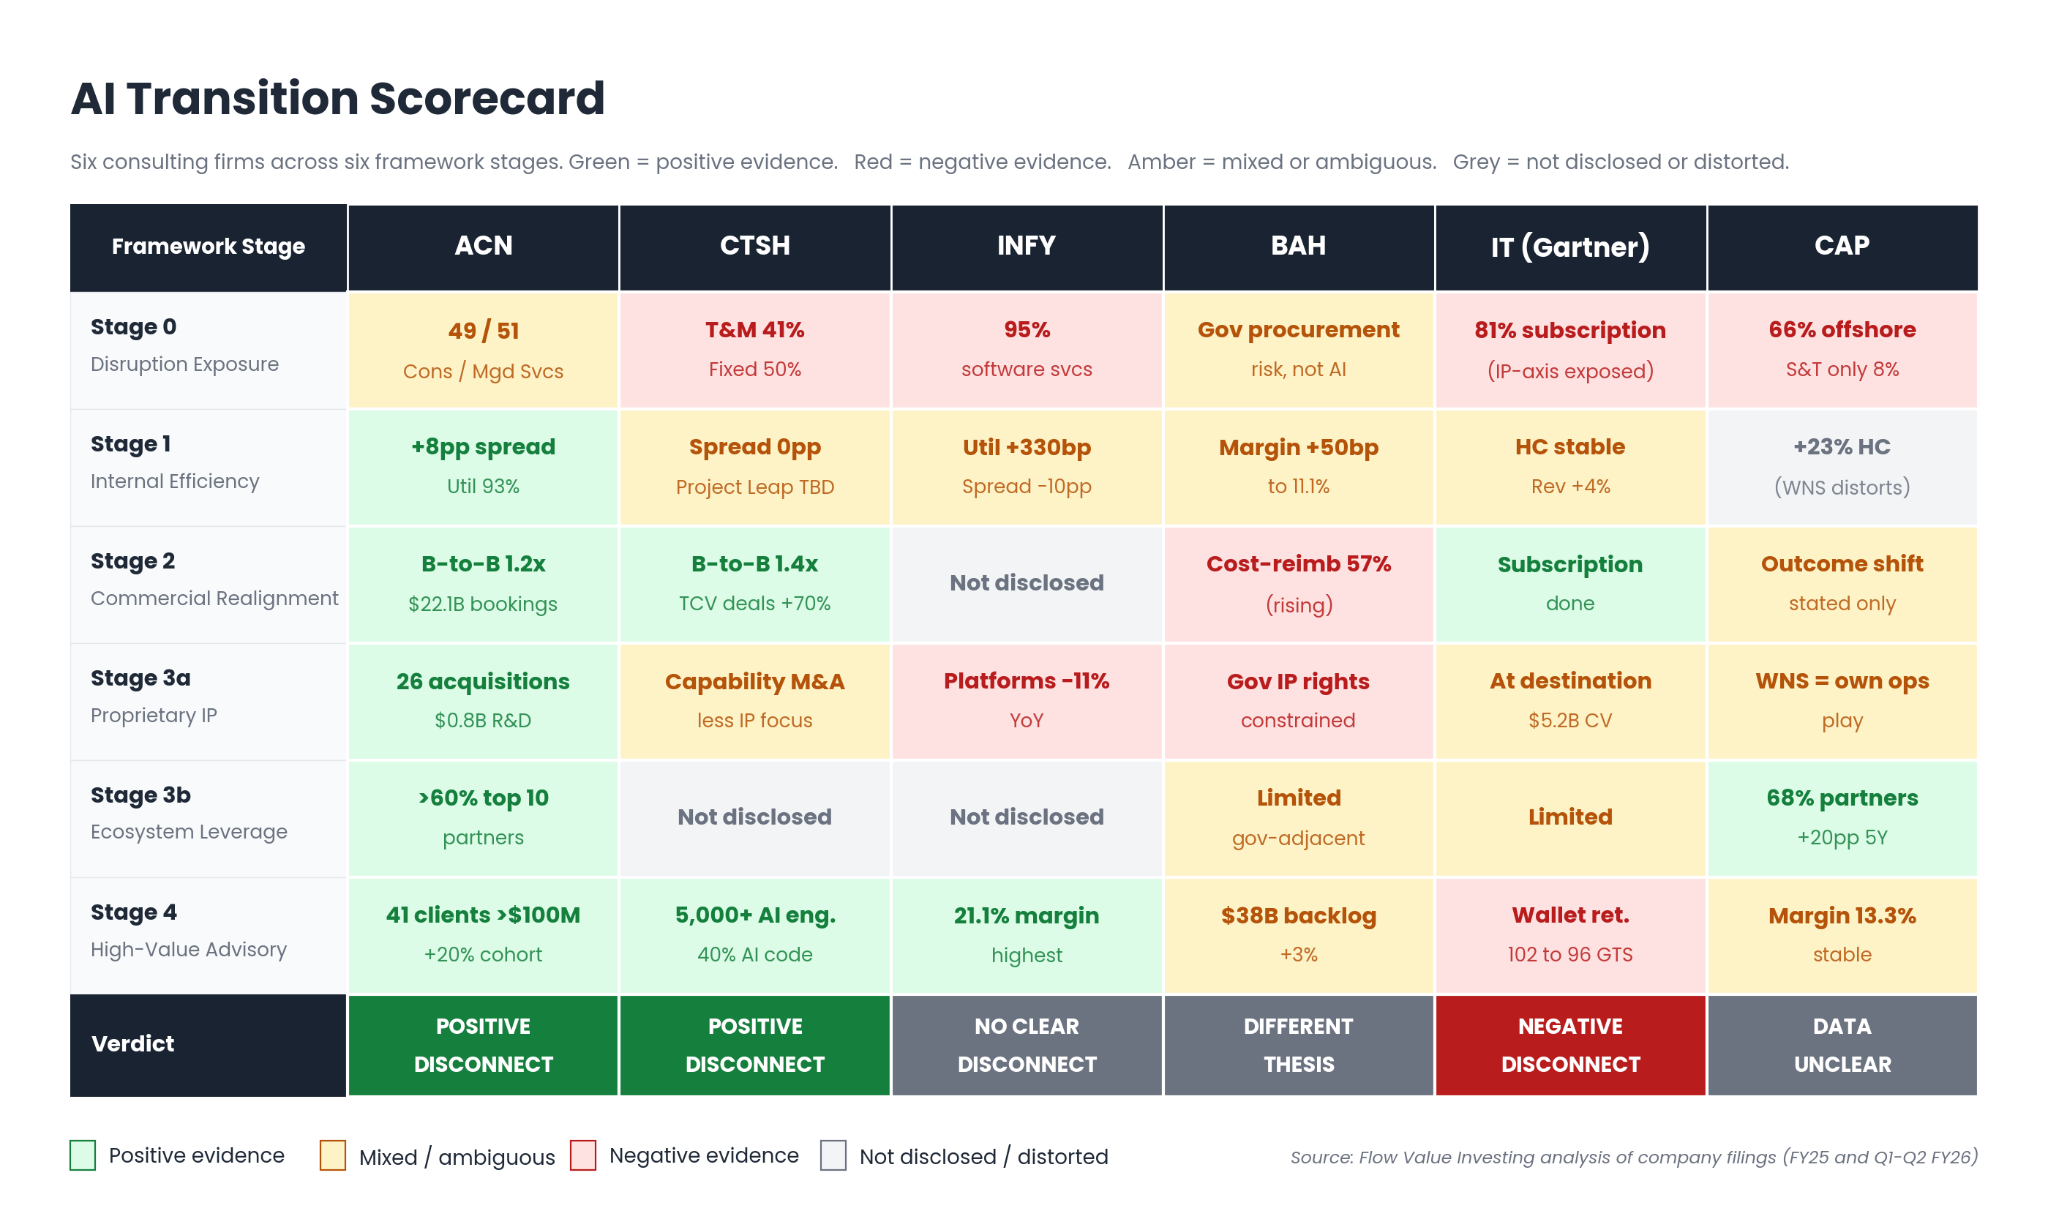
To compare the six firms on a like-for-like basis, I use an enhanced six-stage framework. Each firm gets reviewed on each stage. The output is a profile, not a single score.
Stage 0: Disruption Exposure. How much revenue sits in work AI can directly substitute.
Stage 1: Internal Efficiency. Is the firm using AI to raise output per employee. Measured by revenue per employee, the spread between revenue growth and headcount growth, utilisation trend.
Stage 2: Commercial Realignment. Is the firm shifting from billable hours to fixed-price and outcome-based contracts. Measured by contract type mix, book-to-bill, bookings growth.
Stage 3a: Proprietary IP. Is the firm building software, platforms, or licensable IP that generates revenue independently of headcount.
Stage 3b: Ecosystem Leverage. Is the firm embedded in the AI and cloud technology stack clients are buying. Measured by partner-driven revenue and partnership depth.
Stage 4: High-Value Advisory. Is the firm positioned at strategic, hard-to-automate work. Measured by margin stability, large deal concentration, client retention.
One disclosure caveat applies throughout. Some KPIs are clean for two or three firms and unavailable for the others. Gaps are flagged as they arise rather than filled with estimates.
Stage-by-stage analysis of the six firms
Accenture (ACN). Down 34%.
ACN is the largest pure-play consulting and IT services firm. The most relevant question to ask is whether the operational data confirms the AI loser narrative implied by the share price.
Stage 0: Consulting/Managed Services revenue mix is 49/51 in Q2 FY26, with Managed Services crossing 50% for the first time. Managed services contracts are longer-cycle and less hourly than consulting work, so the proportional shift is structurally protective. Roughly half the revenue still sits in higher-disruption consulting territory.
Stage 1: The strongest signal in the peer set. Headcount down 2% year on year while revenue grew 6.25%. That is an 8 percentage point positive spread. Utilisation at 93%, a record. AI is visibly raising output per employee.
Stage 2: Q2 FY26 bookings of $22.1B, a record. Book-to-bill 1.2x overall, 1.3x consulting. Forward demand is accelerating, not slowing. Contract type split not disclosed in detail, but the Ookla acquisition added $231M in non-FTE subscription and licensing revenue, a direct outcome-priced revenue stream.
Stage 3a: Best dimension, and the M&A story sits here. ACN completed 26 acquisitions over FY24 to H1 FY26. The pattern is coherent with the framework, not opportunistic. Ookla brought subscription network data, Faculty AI brought a proprietary AI agent platform, LearnVantage brought a subscription learning platform, DLB Associates brought data centre engineering capability. The M&A is a deliberate fast-track of Stage 3a, buying capabilities and recurring revenue streams that would take years to build organically. R&D spend $0.8B in FY25.
Stage 3b: Over 60% of revenue driven by the top 10 ecosystem partners (Microsoft, AWS, Google Cloud, SAP, ServiceNow, Adobe, IBM, Oracle, Workday, Salesforce). Partner-driven revenue is growing faster than the firm average. ACN expects to more than double bookings from emerging AI partners in FY26.
Stage 4: 41 clients with quarterly bookings above $100M, up from the low-30s a year earlier. That is over 20% growth in the large-deal cohort. Operating margin Q2 FY26 13.8% GAAP, up 30 basis points year on year. ACN also took $615M in business optimisation costs in FY25, primarily severance and asset write-downs on two acquisitions no longer aligned with strategy. That is the other side of the transition: paying upfront to exit lower-value hourly work.
Verdict. Six out of six stages point in the same direction. The M&A pattern is the clearest evidence of strategy, not just adaptation. Buy capabilities and recurring revenue for the future, pay severance to exit the past. The 33.9% share price drop does not reconcile with the operational data. Clear positive disconnect.
Cognizant (CTSH). Down 36%.
CTSH runs an offshore, headcount-based IT services delivery model. The bear case is structurally credible: this is exactly the work AI compresses first.
Stage 0: Highest disruption exposure in the peer set. Service line breakdown: Consulting and technology services 64.5%, Outsourcing services 35.5%. North America 74.9% of revenue. Critically, the contract type mix is the most explicit single signal in the data: Time-and-materials 40.8%, Fixed-price 50.3%, Transaction or volume-based 8.8%. Roughly 41% of revenue sits in work where price is directly linked to hours.
Stage 1: Neutral. Headcount grew 6.3% year on year, revenue grew 5.8%, spread is essentially zero. Utilisation stable at 85%. AI productivity is not yet visible in the labour data. CTSH announced Project Leap in Q2 2026, a productivity and operating model redesign explicitly aimed at AI-led efficiencies. The direction signal is forthcoming, not current.
Stage 2: The strongest forward demand signal in the peer set. TTM bookings $29.6B, up 11% year on year. Q1 quarterly bookings up 21%. Book-to-bill 1.4x, the highest in the group. Seven large deals (greater than $100M total contract value) signed in Q1 alone, including one mega-deal greater than $500M. Total contract value of large deals up over 70% year on year. The bookings story directly contradicts an AI-disruption narrative.
Stage 3a: Weakest dimension. CTSH does not disclose a software or licensing revenue line. Acquisitions over FY24 and FY25 (Belcan, Thirdera, 3Cloud) are capability acquisitions, less explicitly tied to non-FTE revenue than ACN’s pattern. R&D not separately broken out.
Stage 3b: Not disclosed in the same format as ACN. Partnership references exist in earnings materials but no equivalent of the 60% partner-driven revenue figure.
Stage 4: Over 5,000 AI engagements running. Nearly 40% of code AI-assisted (company sampling). Operating margin Q1 26 GAAP 15.6%, stable year on year. Margins are holding under the same disruption pressure that is supposedly destroying the business model.
Verdict. Strong on Stages 2 and 4, neutral on Stage 1, undisclosed on Stages 3a and 3b. Less complete than ACN, but the bookings data alone is hard to reconcile with the share price decline. Project Leap delivery over the next 2-3 quarters is the data point that will confirm or undermine the positive disconnect read. Positive disconnect candidate, with one open question.
Infosys (INFY). Down 30%.
INFY trades on the highest multiple in the peer set with forward equal to trailing, implying zero earnings growth. For an offshore headcount-based IT services firm, that is consistent with an AI-disruption thesis being priced in. Walking the stages tests whether the implied story is supported.
Stage 0: Software services 95.3% of revenue. Products and platforms only 4.7%. Geographic split: North America 57.9%, Europe 29.8%. The fundamental delivery model is offshore, headcount-based IT services, the highest-exposure category to AI compression.
Stage 1: Internally contradictory. Utilisation excluding trainees rose from 82.2% in FY24 to 85.5% in FY25, a 330 basis point gain. That is a positive Stage 1 signal. But the headcount-revenue spread is sharply negative: headcount grew over 14% while revenue grew under 4%, a spread of around minus 10 percentage points. The firm is adding labour faster than it is generating revenue, the opposite of AI-driven efficiency. The two signals point in opposite directions.
Stage 2: Limited disclosure. INFY uses time-and-material, fixed-price, and unit-of-work contracts but does not publish the percentage split. No book-to-bill ratio. Cannot be cleanly evaluated.
Stage 3a: Worst dimension. The platform revenue (Finacle banking, Edge, Panaya, Stater, McCamish) is real but shrinking, from $1,013M in FY24 to $898M in FY25, an 11% decline. INFY has an internal AI framework (Topaz, Lean AI) but those are productivity initiatives, not customer-facing licensable IP. M&A is small-scale capability bolt-on (The Missing Link, MRE Consulting) rather than IP plays.
Stage 3b: No disclosed partner-driven revenue percentage.
Stage 4: Operating margin highest in the peer set at 21.1%, ahead of ACN at 14.7% and CTSH at 15.6%. Strong profitability today. No client retention or large-deal cohort data disclosed.
Verdict. Three positives (margin, utilisation, profitability). Three negatives (Stage 0 exposure, Stage 1 spread, Stage 3a IP decline). The zero implied earnings growth in the multiple is roughly consistent with the negative dynamics outpacing the positive over time. Not a clear positive disconnect. Possibly a slight negative disconnect, but the margin strength makes the timing uncertain. Not a candidate for further options work on the AI thesis until the labour spread or the platform decline reverses.
Booz Allen Hamilton (BAH). Down 7%.
BAH did not fall with the rest of the peer set because its core risk is not AI. The framework partially breaks for BAH, and that itself is the main finding.
Stage 0: BAH’s disruption source is different from the AI thesis driving the rest of the peer set. Revenue declined 6.4% in Q4 FY26, driven by a slowed US federal procurement environment. DOGE-related cuts have reduced non-defence federal obligations by 20.5% year on year. The risk is political and budgetary, not AI substitution.
Stage 1: BAH does not disclose utilisation in the same format. Adjusted EBITDA margin rose 50 basis points to 11.1%. Headcount declining alongside revenue.
Stage 2: Structurally constrained. Contract type mix has moved in the wrong direction for AI productivity capture: cost-reimbursable rose from 53% in FY23 to 57% in FY25. Time-and-materials and fixed-price both declined as a share. When BAH automates work on a cost-reimbursable contract, the government client captures the savings, not BAH. The procurement framework dictates contract types. BAH cannot simply reprice to outcomes.
Stage 3a: Also structurally constrained. The BAH 10-K notes the government can claim rights in solutions, systems, and technology produced by the firm, and disclose them to competitors. Building proprietary IP on government contracts is difficult to monetise externally.
Stage 3b: Defence-adjacent partnerships (AWS GovCloud, Palantir via the Decho acquisition) at smaller scale than commercial peers.
Stage 4: Backlog stable at $38B, up 3% year on year. High-clearance domain expertise in national security and defence analytics is structurally protected from both AI and offshore competition. Security clearance density is the equivalent moat to commercial firms’ large-deal cohort.
Verdict. The framework only partially applies. BAH’s AI exposure is lower, but the upside from AI execution is also structurally capped by government contracting rules. The 6.9% drop correctly reflects that AI is not the dominant risk. BAH belongs in a separate thesis focused on US government spending stabilisation. Not a value gap candidate on the AI thesis.
Gartner (IT). Down 35%.
Gartner is the case that forces the framework refinement noted earlier. The framework assumes a consulting firm trying to transition from labour-based delivery toward IP and subscriptions. Gartner has been at that destination for decades. The relevant question is whether the destination itself is now under attack.
Stage 0: Looks inverted at first glance. Insights, a subscription research product, is 81% of revenue with $5.2B in contract value. Conferences 10%, Consulting 9%. Gartner does not have a large pool of billable consulting hours for AI to compress.
But Stage 0 was designed to measure exposure to one specific AI threat: substituting consultant labour. Gartner is exposed to a different threat: AI substituting the IP itself. The research, frameworks, and benchmarking that clients pay for are exactly the type of output frontier models can increasingly produce internally. Stage 3a defends against threat type one. It does not defend against threat type two. Stage 0 for Gartner needs to be read on this second axis, where exposure is high.
Stage 1: Headcount roughly stable at 20,244. Revenue grew 4%. Consulting segment utilisation declined from 65% to 61%, billable headcount down 2%. The smallest segment is contracting, but that is the consulting business, not the core subscription.
Stage 2: Already done. The subscription model is the destination of Stage 2. 77% of Insights contracts are multi-year. No billable hours mechanic for the core product.
Stage 3a: Already at the destination. The question for Gartner is no longer whether it can build IP, it is whether existing IP is being commoditised.
Stage 3b: Limited. Gartner is more of a destination for advisory than an embedded ecosystem participant.
Stage 4: This is where deterioration is visible and most relevant. Wallet retention for Global Technology Sales fell from 102% to 96% year on year (decreased spending by existing clients). For Global Business Sales it fell from 106% to 99%. These are not catastrophic numbers individually, but they reverse a multi-year trend of expanding spend per client. Insights contract value growth slowed to 1% on an FX-neutral basis. Total quota-bearing salespeople fell 2% year on year. Operating margin fell from 18.4% to 15.8%, with underlying SG&A growing 6% (faster than revenue) on top of a $150M goodwill impairment.
Verdict. The apparent contradiction (Gartner is at the destination consulting firms want to reach yet is showing the most stress) resolves once the threat types are separated. Gartner is protected from AI replacing consultant hours but exposed to AI replicating its IP. The retention and contract value metrics suggest the second erosion is starting. The 34.7% share price drop may not be enough if the subscription moat itself is gradually weakening. Negative disconnect candidate, with the magnitude question genuinely open: is the price still too high relative to the erosion, or has the market already gone too far. Worth further work on whether the retention trend has stabilised or accelerated in subsequent quarters.
Capgemini (CAP). Down 27%
CAP is the most M&A-distorted name in the set. The 2025 WNS acquisition makes Stages 0 and 1 hard to read on reported numbers, but the strategic logic of the M&A is itself the interesting framework signal.
Stage 0: Service line mix: Strategy and Transformation 8%, Applications and Technology 63%, Operations and Engineering 29%. Offshore ratio 66%. Structurally similar exposure to CTSH and INFY in delivery model terms.
Stage 1: Headcount grew 23% year on year, but this is almost entirely the WNS acquisition. On a like-for-like basis the spread is closer to neutral. Utilisation in Strategy and Transformation rose from 67% to 70% over five quarters, a small positive signal that is not WNS-distorted.
Stage 2: Capital Markets Day 2026 was explicit about shifting to outcome-based commercial models and value-centric AI transformation. No disclosed contract type split. Reported organic growth Q1 2026: Strategy +6.2%, Applications +4.8%. The 25.2% growth in Operations and Engineering is largely WNS, so the organic Stage 2 read is partial.
Stage 3a: The M&A story is the strategically interesting angle. Read at first glance, WNS looks like buying more of the highest-disruption-exposure work. The strategic logic CAP gives is different. By owning the business process operations rather than just supplying the labour for them, CAP captures the contractual fee even when AI agents eventually replace the human operators. It is a vertical integration play: buy the customer relationship before AI does. Whether this works depends on whether AI agents replacing human operators preserve the contractual relationship with the buyer of operations, or whether buyers will eventually contract directly with AI providers. The bet is the former. Other acquisitions (Syniti for data, Cloud4C for cloud) reinforce the same logic of buying enterprise relationships and capabilities.
Stage 3b: Strongest dimension. Core Partner Bookings 68% of group total in 2025, up from 48% in 2020 (a 20 percentage point increase over five years). Tier-1 AI partnerships are unusually broad: Mistral, OpenAI, Anthropic, Google, Palantir, SAP, Microsoft, AWS. This signal is not distorted by acquisitions.
Stage 4: Operating margin stable at 13.3%. 194,775 employees upskilled on Agentic AI. Large deal data not disclosed in the same format as ACN.
Verdict. The strategic positioning argues for a positive disconnect. The M&A pattern is coherent with the framework, just executed through a different angle than ACN (own the operations versus buy the IP). Stage 3b ecosystem leverage is genuinely strong. But the acquisition noise prevents a clean read on Stages 0 and 1 right now. Not a clear value gap candidate yet. Re-evaluate in 2-3 quarters once WNS integration normalises and organic data becomes visible.
Summary
Subscribe to the Flow Value Investing community for full access to the evaluation model, live trading updates, the Value Gap analysis tool, a curated Value Gap shortlist, and more.
Where the evidence supports clear winners and losers
Two firms show clear positive disconnects: ACN and CTSH. Both have been priced as AI losers, but the operational data, especially forward bookings, AI engagement, and M&A pattern, is consistent with firms winning AI-related work, not losing it. ACN is the more complete case; CTSH has one stage (Project Leap delivery on Stage 1) that needs to be confirmed.
One firm shows a clear negative disconnect: Gartner. Being at the destination of Stage 3a does not protect against AI commoditising the IP itself, which is a different threat. The retention and contract value metrics suggest that erosion is starting. The 34.7% share price drop may not be enough.
Three firms are not value gap candidates on this thesis: INFY (mixed signals, margin strength offsetting structural weakness), BAH (different risk story), CAP (acquisition noise needs to clear before the data is readable).
What this does not tell you
Identifying a disconnect is the first filter. Accenture is the strongest candidate from this analysis and the next deep dive. The work covers gap depth, catalyst window, and whether timing and sentiment support entry. Published here next week.
Sources: ACN 10-K FY25, 10-Q Q2 FY26 and investor presentation; CTSH 10-Q Q1 2026 and earnings supplement; INFY 20-F FY25; BAH 10-K FY25 and Q4 FY26 earnings; Gartner 10-K 2025 and William Blair conference presentation; Capgemini Q1 2026 revenues, 2025 Annual Report and Capital Markets Day 2026.
This post reflects my personal investment research process. It is not financial advice.
That's a perfect example of the kind of articles I am looking for on Substack! Found it while searching for takes on Cognizant; the stock appeared on my screener, and I am considering more thorough research. I took away some useful points.
What're your thoughts on $G?