
The Broken Wing Play:
A Structured Bet on Mercedes Mean Reversion

Mercedes Group (MBG.DE)
Value Gap Analysis | February 2nd 2026
EXECUTIVE SUMMARY
Mercedes rallied nearly 20% from €51 to €61 between September and December 2025, yet this surge stands in stark contrast to deteriorating fundamentals: revenue declined 8% year-over-year with EBIT margins collapsing from 9.4% to 4.5% based on Q1-Q3 data.
This disconnect caught my attention as a potential negative value gap opportunity within a struggling European automotive sector.
Since I started looking at Mercedes a month ago, the price has declined by about 5%.
Thesis: BEARISH | Target: €45-50 | Downside: -15% to -22%
1.The Setup: Why Is Mercedes Up Despite Deteriorating Fundamentals?
Mercedes faces a puzzling situation: the stock rallied nearly 20% from September to December 2025 while core metrics were heading in the wrong direction. Understanding why this happened, and whether it’s justified, is essential to identifying the value gap.
Three Forces Drove the Rally
1. Expectations Reset Lower
By Q2 2025, the market had already priced in disaster. European auto stocks were trading at multi-year lows, analyst sentiment was uniformly negative, and Mercedes was being lumped together with struggling peers like Stellantis. When Q3 results came in “less bad than feared”, with margins compressing but not collapsing, the stock caught a relief rally. In markets, beating low expectations often matters more than absolute performance.
2. €2B Share Buyback Announcement
In early November, Mercedes announced a €2B share repurchase program. At current trading volumes, this represents meaningful buying pressure, roughly 3-4% of the float. Buybacks create a floor under the stock price and signal management confidence (whether justified or not). The announcement alone triggered a multi-day rally.
3. Product Offensive Optimism
Management has been aggressively marketing the 2026-2027 product offensive. 45+ new models including the highly anticipated CLA, the new MB.OS operating system, and refreshed electric platforms. Investors are betting that Mercedes can recapture lost ground once these products hit the market. The stock price reflects hope for a turnaround, not current fundamentals.The result: a stock that’s rallied on sentiment and capital returns while the underlying business continues to deteriorate. This is the essence of the potential value gap.
While the stock was rallying, operating performance was heading in the opposite direction. Two primary challenges are eroding the business.
Catalyst 1: Competition and Weak Demand in China
Mercedes is facing its biggest challenge in China, where conditions in the premium car market have shifted dramatically. The emergence of domestic players offering competitive technology at lower prices has compressed market values, even as unit sales remain relatively stable. The aggressive EV push by Chinese manufacturers, combined with challenging economic conditions, has inflicted heavy losses on European premium brands.
China Premium Car Market (vehicle > 40kUSD)

Key Question: What’s driving the decline in China’s premium car market? Is it consumers preferring more affordable domestic brands, or simply a weaker economic environment?
The answer is both, but the structural component is more concerning than the cyclical one.
The decline in China’s premium car market reflects a “perfect storm” where a structural shift in consumer preferences has collided with a cooling macroeconomic environment. While traditional luxury brands like BMW, Mercedes-Benz, and Porsche are seeing double-digit sales drops, the decline isn’t a total exit from the high-end segment, it’s a migration toward domestic tech-centric brands like Li Auto, AITO, and Zeekr.
Modern Chinese consumers increasingly prioritize what I call “tech literacy”—advanced autonomous driving, smart cockpits, seamless digital integration—over legacy brand heritage. They view domestic NEVs (New Energy Vehicles) as offering superior value and innovation at comparable price points. This shift is amplified by a fragile economic climate: a prolonged property crisis and fluctuating consumer confidence have made even affluent buyers more discerning. There’s a documented move away from “conspicuous consumption” toward “true value,” where buyers either opt for high-spec domestic alternatives that provide more utility, or simply hesitate to flaunt wealth in a more conservative financial atmosphere.
This isn’t merely cyclical weakness; it represents a structural shift in consumer behavior that Mercedes hasn’t yet cracked.
Catalyst 2: Tariffs and Inventory Management in North America
The North American story is different but equally concerning. Sales declined 11% YoY. Mercedes-Benz’s 12% drop in U.S. wholesale volumes reflects a tactical divergence from retail demand, which remained resilient with a modest 1% year-over-year increase.
Management attributes this contraction to a strategic “inventory purge” designed to clear dealer lots ahead of a major 2026 product offensive, combined with cautious supply-chain management amid shifting tariff uncertainties.
While a cooling EV market and aggressive competition from BMW and Lexus pushed Mercedes to third in U.S. luxury rankings, the brand’s deliberate pivot toward high-margin segments (AMG, G-Class) underscores a “value over volume” strategy. This approach focuses on long-term margin preservation over short-term unit growth, positioning the company for a higher-quality earnings profile as it enters its next product cycle.
The question is whether this is genuine strategic positioning or narrative management for declining competitiveness.
2. Quality Check: Is Mercedes in a unique situation?
I’m broadly bearish on the entire European automotive sector. The devastating growth of local EV players in China, sluggish demand in Europe (itself threatened by Chinese EVs), and protectionism in the U.S. create a hostile environment. These conditions are largely priced into current valuations, parts suppliers trade at record lows and brands are suffering across the board.
Within this bearish landscape, I’m searching for specific value gap opportunities where the market has mispriced individual companies. Mercedes appears to be a candidate, but let’s verify whether it’s truly anomalous or simply moving with its peers.
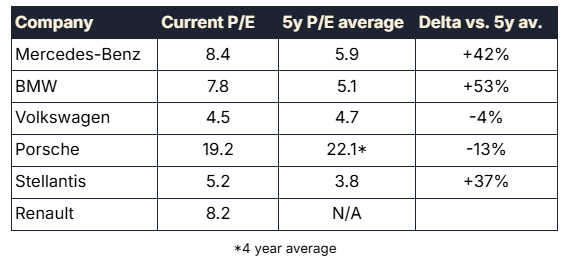
Interpretation: Mercedes currently trades at a 42% premium to its own 5-year average P/E, despite significantly worse fundamentals than during periods when it traded at lower multiples. In late 2023, Mercedes reached a trailing P/E of 4.4x while generating substantially higher margins. This historical context suggests the current valuation has room to compress.
━━━━━━━━━━━━━━━━━━━━━━━━━━━━━━━━━━━━━━━━━━━━━━
FRAMEWORK NOTE
This “Quality vs. Valuation” mismatch is the foundation of value gap investing. When a company’s operational metrics deteriorate but its valuation expands, the market is pricing in expectations that may not materialize. In the Discord community, we share 2-3 new opportunities monthly using this systematic framework.
Want to learn how to identify these setups yourself? Join the free Discord community.
━━━━━━━━━━━━━━━━━━━━━━━━━━━━━━━━━━━━━━━━━━━━━━
3. Current Valuation: Premium Despite Deterioration
At current prices, Mercedes trades at its highest valuation multiples over the past 5 years and above the peer median, despite all key financial KPIs having deteriorated compared to last year.
The only exception is cash conversion, which has improved. But this is actually a warning sign: Mercedes is converting earnings to cash more efficiently only because they’re cutting production, reducing inventory, and managing working capital aggressively. These are classic signs of a company in defensive mode during a downturn, not indicators of operational excellence.
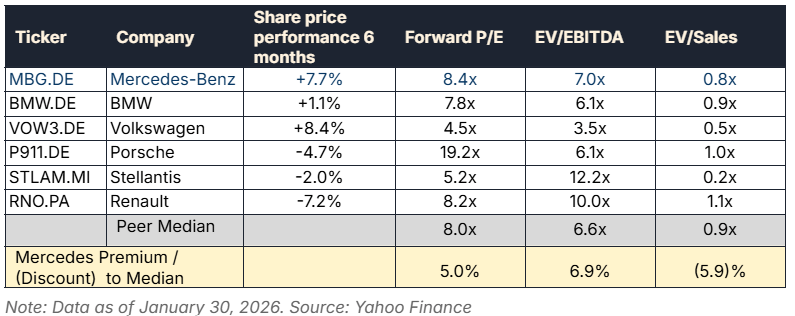
Automotive Efficiency Scorecard: Identifying Valuation Gaps in European OEMs
The Automotive Efficiency Ranking uses an ordinal point system to evaluate operational excellence in a volatile market. Rather than a simple percentage sum, this model ranks companies from 1 (best) to 6 (worst) across three critical KPIs: Revenue Growth, Margin Momentum (YoY Change), and Absolute Operating Margin.
The lower the aggregate score, the better the company balances growth with profitability. This framework reveals whether valuation multiples align with operational reality.
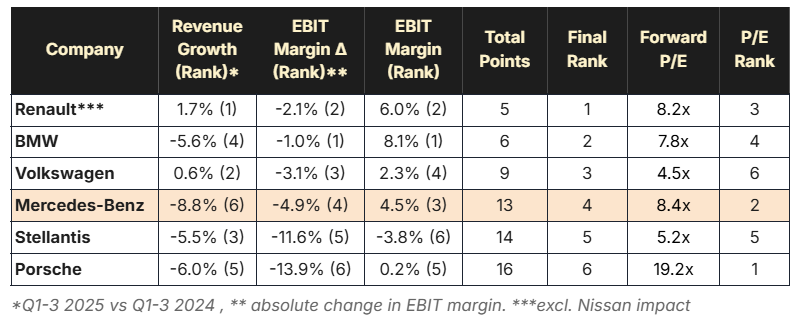
Interpretation: Mercedes reported the sharpest revenue decline YoY at nearly –9%. None of these OEMs had significant M&A activity that would distort the analysis. Based on all three operational factors, Mercedes ranks #4 operationally but carries the #2 highest P/E multiple, a clear valuation-quality mismatch.
The most blatant gap is actually Porsche, which commands the highest P/E (#1) despite the weakest operational performance (#6). This may signal an even larger opportunity worth investigating separately.
4. Market Position: What’s Happening in the Premium Car Segment?
Understanding Mercedes’s competitive position helps contextualize both the China market share concerns and whether the company’s decline represents a temporary setback or structural erosion.
Mercedes’s Global Footprint
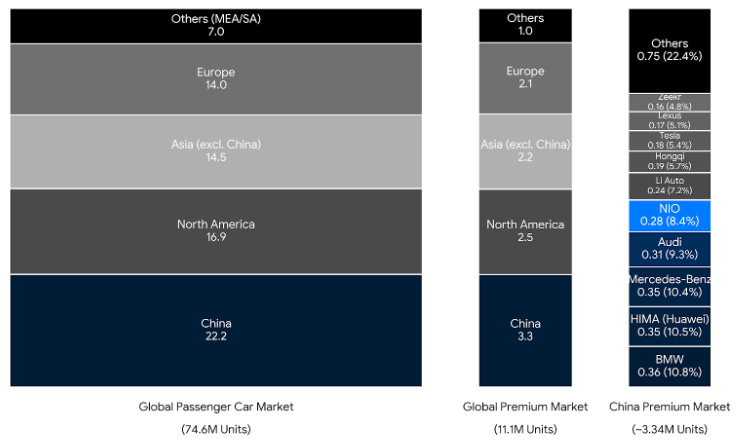
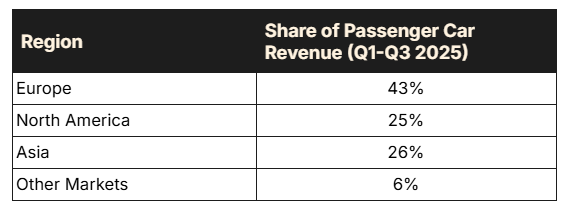
The global passenger car market moved approximately 75 million units in 2025. With roughly 2.2 million units sold, Mercedes holds a ~3% share by volume but commands nearly 20% of the premium segment. In China, that premium share has been decreasing sharply, but Mercedes remains a top player. With 15% of revenues generated in China, it’s still a critical market.
Geographic Revenue Distribution
The China Problem: Structural, Not Cyclical
Mercedes’s market share in China’s premium segment has eroded to approximately 10%, well below its historical dominance. Chinese players like Huawei (through AITO) have aggressively captured market share, particularly in the low-to-mid premium segment.
My view is that this isn’t a temporary slump caused by economic conditions. There’s a clear change in consumer behavior, and Mercedes is paying the price. Two data points support this thesis:
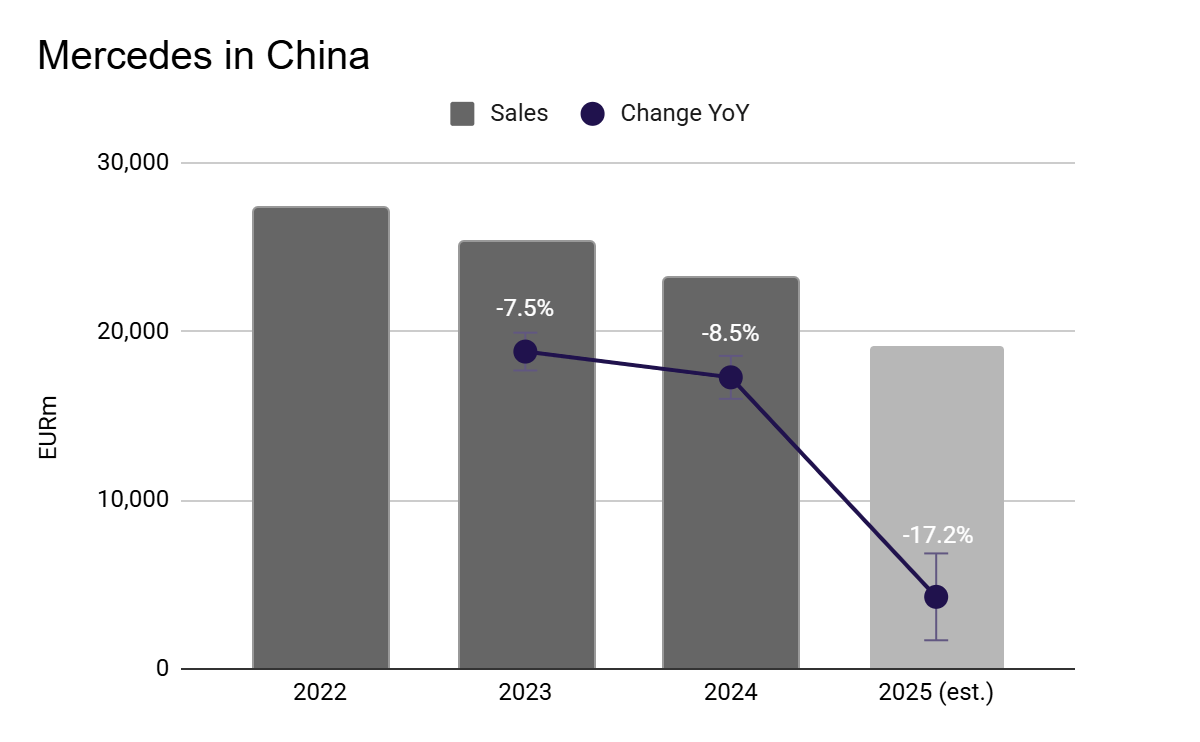
The decline predates current weakness. Mercedes’s China sales decline started years ago and has been accelerating, not stabilizing.
The rest of Asia is also declining. Sales dropped more than 8% in 2024 across non-China Asia, with further declines in 2025.
Both points strongly suggest this is structural rather than temporary.
Why Europe Might Be More Concerning Than It Looks
The European market is where Mercedes still enjoys its strongest brand equity. Overall sales remain relatively stable, but the growing presence of Chinese brands is eroding market share. While this may not affect higher-priced Mercedes models, entry-level vehicles like the A-Class and B-Class face direct competition from Chinese manufacturers like BYD and MG.
The European Commission has been somewhat successful at preventing price dumping from Chinese manufacturers, but these companies are now shifting production to Europe, meaning market penetration is likely to continue. The overall outlook is not optimistic.
North America: The Narrative vs. Reality
In the U.S., unit sales declined ~10% YoY. However, management characterizes this as deliberate inventory management. Mercedes sells to dealerships, and those dealers’ retail sales aren’t double-counted in Mercedes’s reported figures.
According to management, some dealers held significant inventory, and if dealer-level sales are included, U.S. unit sales were relatively stable in 2025. Mercedes apparently reduced wholesale volumes to clear inventory ahead of 2026 product launches and to manage tariff exposure.
While the unit narrative may hold, operating margins remain a genuine concern—tariff impacts in 2025 are estimated at approximately €360 million, representing nearly 0.5 percentage points of EBIT margin compression.
The narrative of deliberate inventory management may be partially accurate, but it conveniently explains away weaknesses that might have multiple causes.
5. The Value Gap: Quantifying the Opportunity
Mercedes is neither the best performer (Renault/BMW) nor the worst (Stellantis/Porsche), but it faces a concerning combination of geographic exposure and company-specific challenges that together explain its significant underperformance versus BMW and moderate underperformance versus mass-market players like Renault.
Based on the analysis above, Mercedes appears overpriced compared to its closest peer (BMW) and its own historical valuation, given 2025’s operational deterioration.
Downside Scenarios
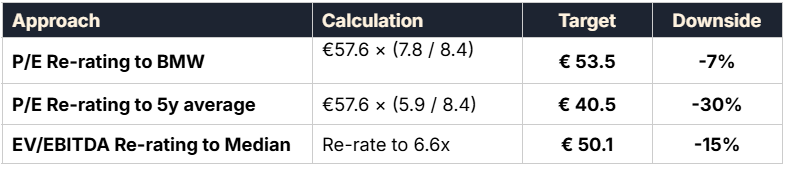
Fair Value Range: €43.5 – €53.5 based on re-rating scenarios
Why the Gap Exists
An interesting historical point: in late 2023, when Mercedes reached its lowest P/E at 4.4x, it was performing significantly better than today. Re-rating based on the 5-year average P/E seems like a credible scenario, while convergence to BMW’s multiple represents a high-probability near-term correction.
The current price appears supported primarily by:
Share buybacks: The €2B repurchase program provides ongoing price support
Outperformance vs. lowered expectations: When everyone expects disaster, merely bad results can trigger rallies
Product launch optimism: The 2026-2027 offensive is priced in before execution proves or disproves its value
The path forward requires Mercedes to simultaneously execute on multiple fronts: China product appeal recovery, new hybrid/EV launches, margin defense, and geographic rebalancing. That’s a challenging combination that will test management’s capabilities over the coming 18-24 months.
6. Risks to the Bearish Thesis
China Market Stabilization
Government stimulus revives luxury demand
Market share stabilizes; premium pricing power returns
Local competitors shift focus to mass market
Favorable Tariff Resolution
Trump administration grants exemptions or <10% tariffs
Product Offensive Success
2026 CLA becomes breakout hit
MB.OS delivers differentiated experience
45+ model rollout validates entire strategy
Potential impact: P/E re-rating toward BMW’s 10x multiple
Margin Recovery Surprise
Cost reductions exceed expectations
Mix shift to higher-margin models accelerates faster
Competitive Relief
Chinese EV makers stumble in Europe
BMW/Porsche face similar headwinds
Key Events to follow:
Next 6 months
Q4/FY Earnings (Feb 12)
Tariff Decision (Mar-Apr)
Q1 Results (Apr 29)
Q2/H1 Results (Jul 28)
CLA Launch (Fall) → Game changer
7. Investment Decision
VERDICT: NEGATIVE VALUE GAP — LOW CONVICTION
The analysis points to a moderate negative value gap. Mercedes trades at a 42% premium to its 5-year average P/E despite significantly worse fundamentals, ranks #4 operationally among European OEMs while commanding the #2 highest valuation, and faces structural headwinds in China that show no signs of reversing.
On paper, this screams “short opportunity.”
However, I’m not executing a trade. Here’s why:
The risk/reward doesn’t meet my threshold. While downside scenarios suggest €40-53 fair value, several factors create asymmetric upside risk that’s difficult to quantify:
Buyback floor: The €2B repurchase program provides meaningful support. At current daily volumes, this absorbs a significant portion of selling pressure.
Sentiment positioning: With analyst consensus at “hold” and a €62 target, expectations are already muted. Bad news may be largely priced in, while any positive surprise (tariff relief, strong CLA reception) could trigger a disproportionate rally.
Timing uncertainty: The thesis may be correct directionally but wrong on timing. Product launches in Fall 2026 could sustain optimism for longer than a June expiration allows.
COMMUNITY INSIGHTS
━━━━━━━━━━━━━━━━━━━━━━━━━━━━━━━━━━━━━━━━━━━━━━
Not every value gap is a trade. One of the hardest skills in investing is distinguishing between “I have an edge” and “I have an opinion.” The analysis above identifies a potential mispricing but if the odds are not convincing, it’s better to stay on the sideline.
In the Discord community, we discuss which opportunities meet our conviction threshold and which remain on the watch list. Learning when NOT to trade is just as valuable as learning when to act.
Following along with active trades is one of the best ways to learn. Join the discussion.
━━━━━━━━━━━━━━━━━━━━━━━━━━━━━━━━━━━━━━━━━━━━━━
8. Options Strategy
For educational purposes, let’s walk through how a bearish options strategy would be constructed for this thesis. This framework applies to any negative value gap opportunity where you DO have sufficient conviction.
Note: This section illustrates how I would structure a trade IF conviction were higher. I have not currently decided to execute this position.
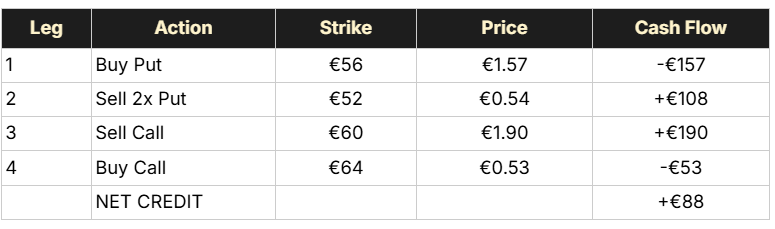
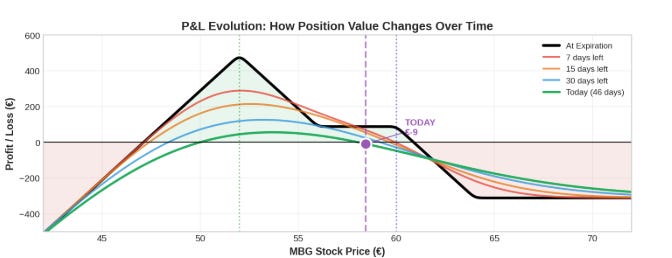
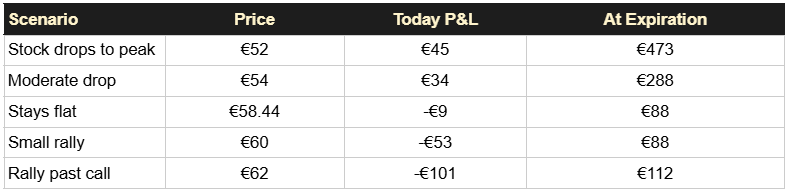
Strategy: Put Ratio + Call Credit
The structure expresses a moderately bearish view with defined upside risk:
If MBG drifts lower toward fair value (€52), we capture maximum profit
If it stays flat or rallies modestly to €60, we still profit from theta decay
We accept downside risk below €47 (consistent with thesis floor)
Upside is capped - we don’t believe MBG sustains above €62
━━━━━━━━━━━━━━━━━━━━━━━━━━━━━━━━━━━━━━━━━━━━━
STRATEGY NOTE
The structure presented is just one structure in the options toolkit. Depending on conviction level and risk tolerance, bear call spreads (credit strategy), long puts, or even staying in cash might be more appropriate.
The hardest part of options trading isn’t knowing how to structure a trade, it’s knowing when your edge is real versus imagined. This Mercedes analysis illustrates both the analytical framework AND the discipline of waiting for better opportunities.
Strike selection, position sizing, and critically, trade selection are covered in depth in the comprehensive course.
Want to master not just options strategy but trade selection discipline? Join the waitlist for the course launching Q2 2026.
━━━━━━━━━━━━━━━━━━━━━━━━━━━━━━━━━━━━━━━━━━━━━━
Want to Learn This Methodology?
This analysis demonstrates the Value Gap Framework, a systematic approach to identifying value gap opportunities and structuring asymmetric options strategies to exploit them.
What You’ll Learn:
In the Free Discord Community:
Real-time trade ideas and monthly value gap analyses
Position tracking and exit decision discussions
Q&A sessions and framework deep-dives
In the Comprehensive Course (Launching Q2 2026):
How to identify value gaps using peer analysis and fundamental metrics
How to structure bull/bear spreads, diagonals, and other fundamental options strategies
When to use options vs stock for different conviction levels
How to size positions and manage risk systematically
When to exit positions (not just hold to expiration)
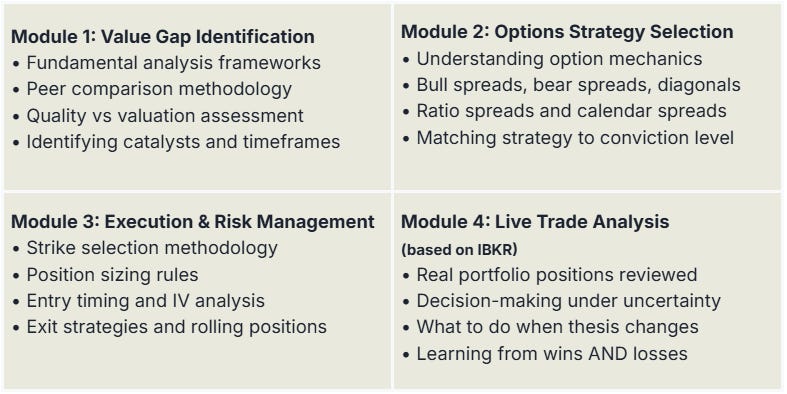
Course Curriculum:
About the Author: Johann Marion is an investment professional with 15+ years of experience in M&A and Private Equity. CAIA charter holder and founder of Flow Value Investing, specializing in value gap analysis combined with options strategies for asymmetric returns.
──────────────────────────────────────────────────
Data Sources: Company filings (Mercedes-Benz Q3 2025 Interim Report, BMW Q3 2025 Report, Renault H1 2025 Presentation, Stellantis 2024 Annual Report), Yahoo Finance, TradingView. Valuation data as of January 30, 2026..
Disclaimer: This analysis represents my personal investment approach and is shared for educational purposes. It is not investment advice. I may initiate positions in Mercedes-Benz options as described in this analysis. Options involve substantial risk and may not be suitable for all investors. The theoretical returns shown are based on holding to expiration at specific price points and are not guaranteed. Past performance does not guarantee future results. You should conduct your own research and consult with a financial advisor before making investment decisions.