
LYV Deep Dive, Part I
A Low-Return Business at a Premium Price

Live Nation Entertainment is the world leader in live entertainment. Whenever you attend a live event somewhere around the globe, there is a good chance your ticket purchase went through the Ticketmaster platform. According to the DOJ complaint, the company controls over 80% of primary ticketing for major concert venues in the US and roughly 60% of concert promotion at major US venues.
The group operates through three segments that are closely connected.
Three segments, one flywheel
The first is concerts. This is Live Nation running its own shows, either in venues it owns or operates under long term leases that give it exclusivity, or in rented third party venues. The venue network covers 460 locations globally, including around 60 of the top 100 US theatres and flagship locations such as the Hollywood Palladium in Los Angeles, The Fillmore in San Francisco, Brooklyn Bowl in New York and the Moody Center arena in Austin. Venue leases typically run for 5 to 25 years and many carry renewal options, so each expiry brings a renegotiation. The footprint is concentrated in North America, at roughly two thirds of venues, with the remainder operated internationally.
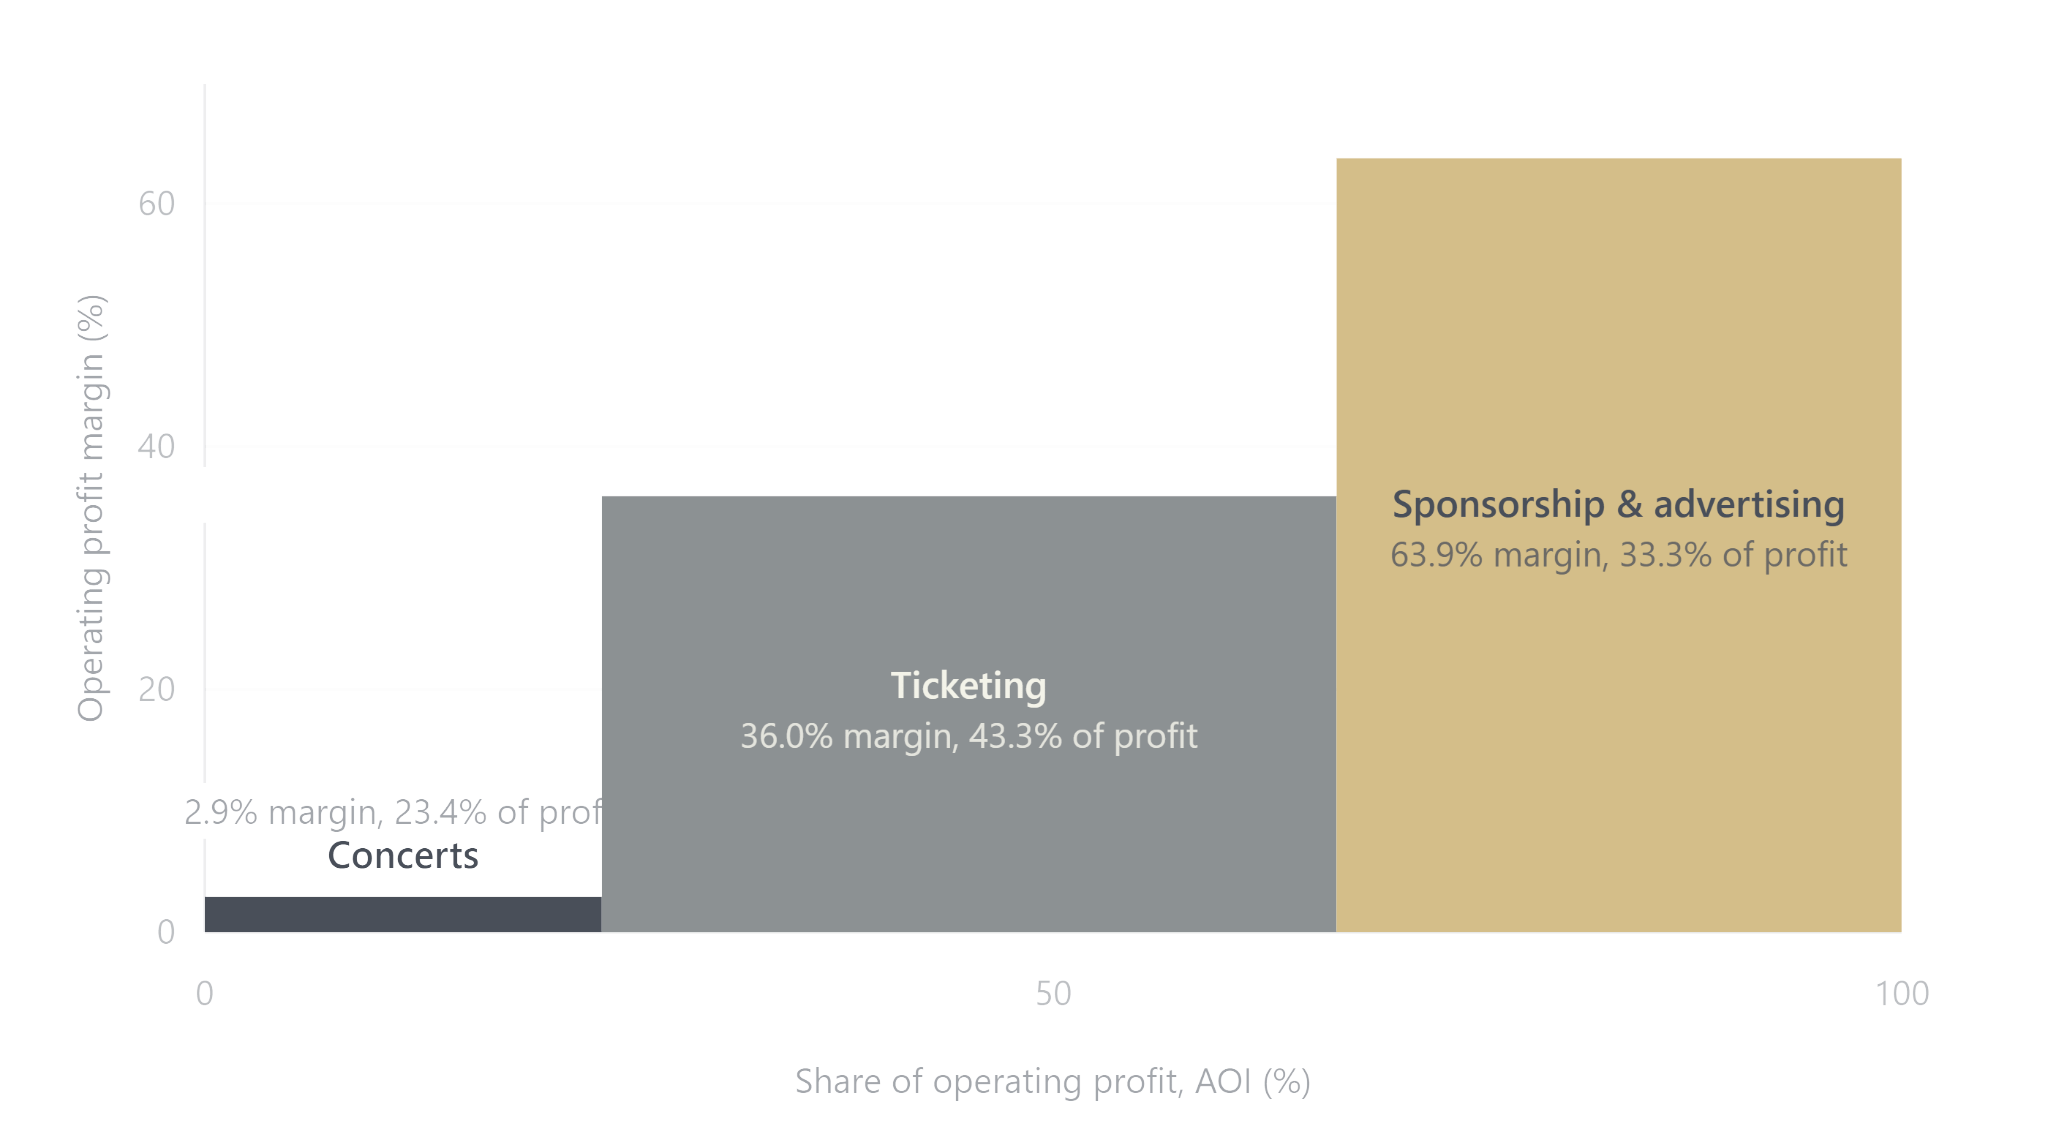
Organising events is expensive. There is staff for the event, equipment, and the artists themselves, who take the majority of the ticket value. Artists are paid through fixed guarantees, a percentage of ticket sales or event profits, or a combination of the two, and Live Nation invests nearly $15 billion a year in artist performances, more than any other company in the industry. Lease costs on top of event costs explain why the margin of this segment is very small. Concerts contributes about 23% of the total operating profit pool despite generating over 80% of group revenue.
LYV makes its money in the other two segments. Ticketmaster is a cost efficient machine that delivers high margins and accounts for the largest share of operating profit (43%). It sells for the group’s own events but also independently for third party events worldwide.
The third segment is Sponsorship & Advertising, directly linked to the group’s own events. LYV raises money from sponsors that get promoted at events through naming rights, venue signage and exclusive partner categories. Much of it goes straight to the bottom line.
LYV - Profit Pool
Growth is fine, the mix is not
Like any business that thrives on large gatherings of people, LYV suffered heavily during COVID. It recovered fast and boomed through 2022 and 2023. Last year the business was still growing at almost 10%, roughly on par with its main competitor, the German operator CTS Eventim. This year the outlook remains strong, with 8-10% revenue growth expected. However, ticket sales are only up 1.3% YTD. Ticketing is a high margin segment, so if growth keeps coming from the low margin Concerts segment, top line growth may not translate well into operating profit. For now, growth in Sponsorship and Advertising offsets the drag.
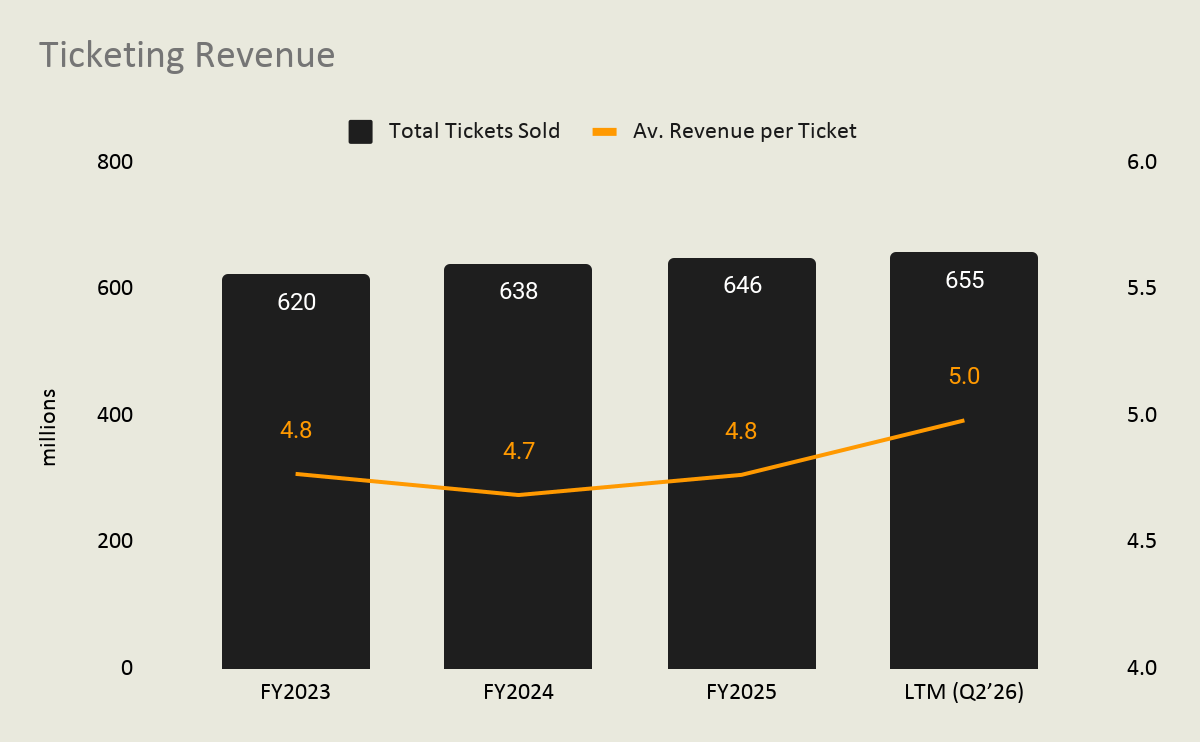
AOI margin is the main operating metric reported by the group. It is essentially an adjusted EBITDA. It strips out acquisition expenses, amortisation of non-recoupable ticketing contract advances, depreciation and amortisation, gains and losses on disposal of operating assets, stock based compensation and, most recently, the provisions booked for the major governmental litigations. AOI margin has been flat over the past three years at slightly over 9%. That may look very low, but it mostly reflects the vast difference in margin across the three segments.
Peer comparison: where the valuation sits
A first look at operating performance against valuation between LYV and its peers provides a hint to why I believe LYV is overvalued.
EV/EBITDA is a convenient way to compare the business with competitors and other entertainment businesses without the distorting impact of differences in capital intensity. EBITDA is a tricky customer though, so I spent quite some time adjusting the numbers of each peer to achieve a good level of comparability.
Looking at the map, I see 4 distinct groups. Bucket 1 is premium multiple, modest operating quality with LYV and SPHR. Bucket 2 is premium multiple, high operating quality: NFLX, TKO. Bucket 3 is low multiple, strong fundamentals with EVD, DIS and finally MSGE which is premium multiple despite low operating quality.
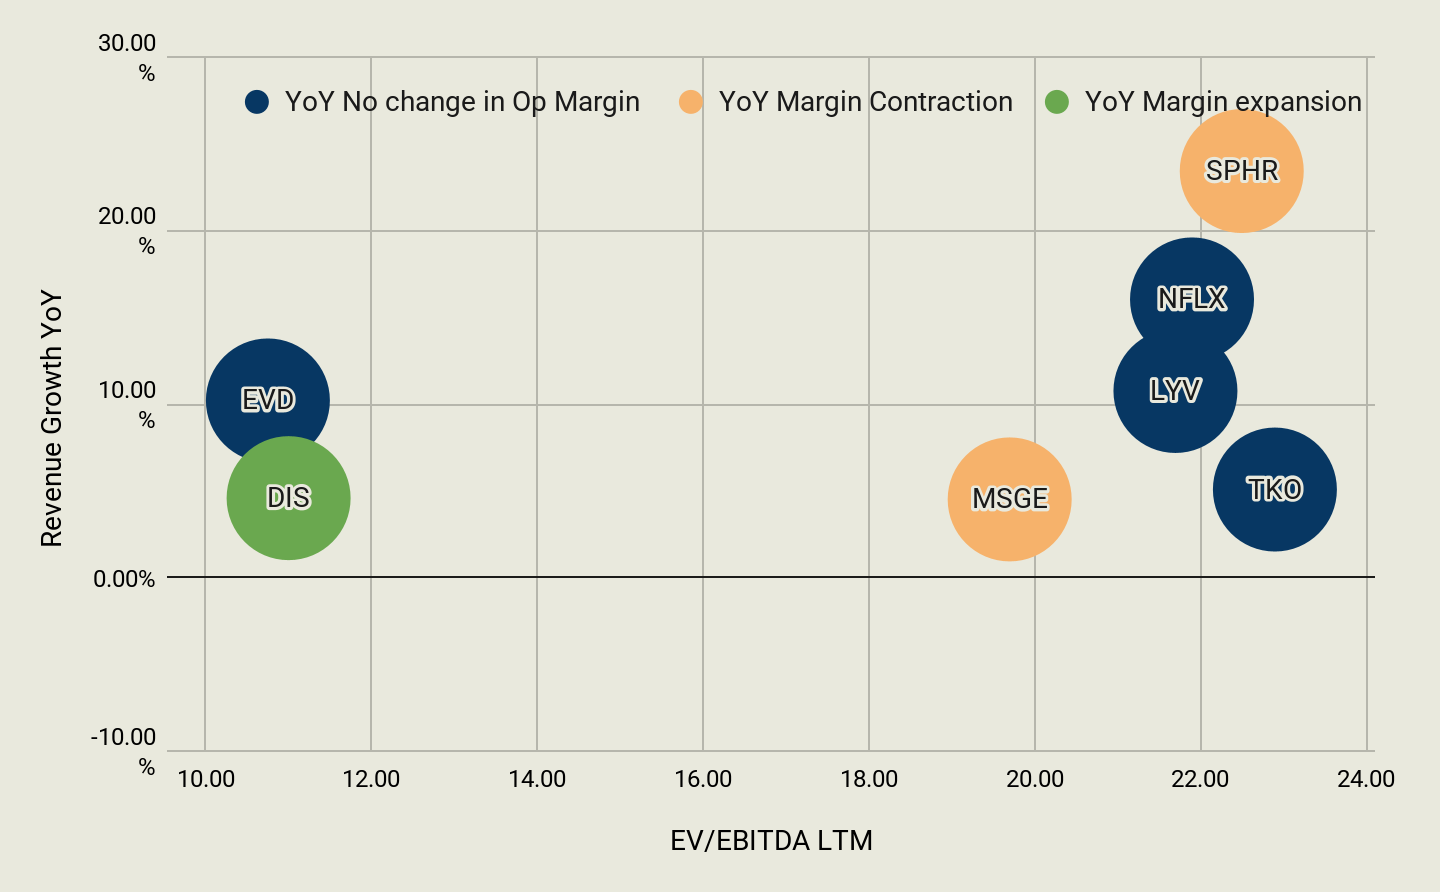

Note that the biggest gap between reported EBITDA and my adjusted figure is NFLX. On reported figures it trades below 10x EBITDA, but that figure adds back content amortisation, which to me is operating cost, so I do not add it back here.
The comparisons that matter most are LYV against EVD and NFLX. EVD is the only large direct competitor, and NFLX represents best in class operations in the wider industry, so it is a useful quality benchmark for the business model.
LYV trades on par with NFLX at around 22x EBITDA, while NFLX still enjoys double digit growth and high margin vs. fragmented growth and low margin for LYV.
The comparison with Eventim is even more compelling. Eventim trades in Germany, so I increased its EV/EBITDA multiple by 25% to neutralise the disadvantage of not being listed in the US. Even after that adjustment, EVD still trades at a wide discount to LYV, despite similar top line growth and higher margins.
Two compelling arguments that support an overvaluation of LYV.
Against its own history, LYV also looks expensive based on unadjusted multiples with large current premium vs. 4 year average. P/E is not reliable and actually negative on an LTM basis, hence the focus on EV/sales and EV/EBITDA.

ROIC completes the picture
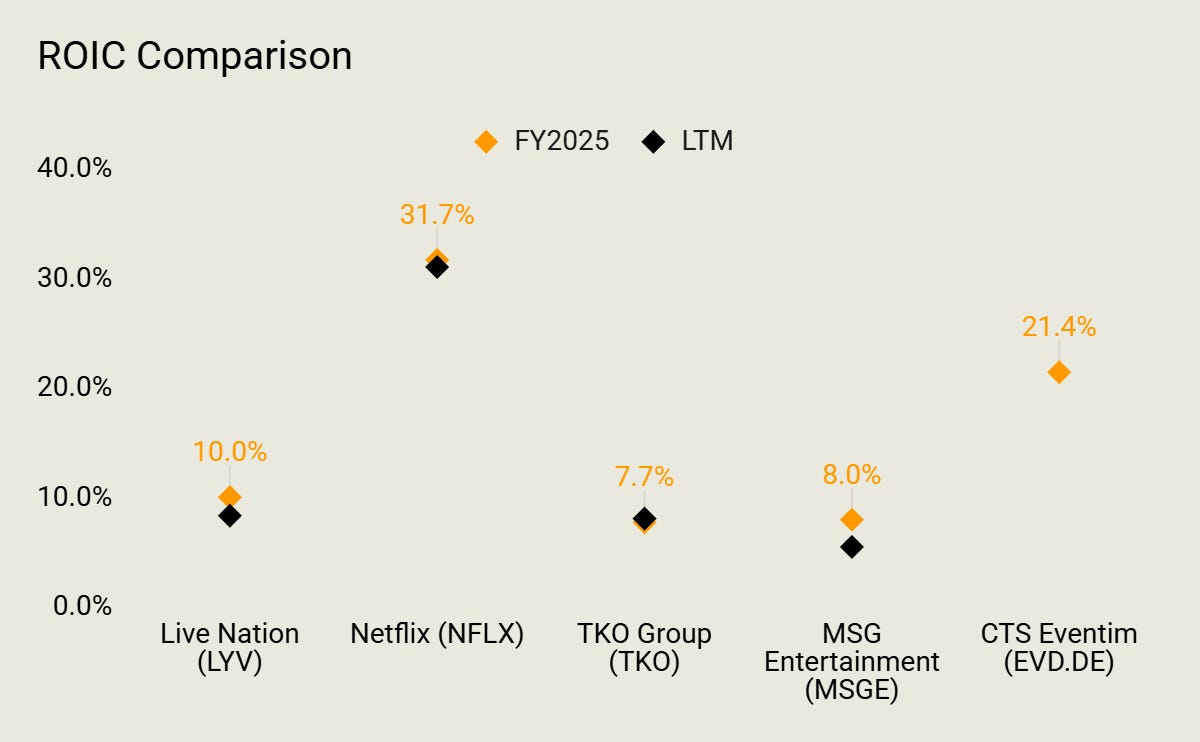
The last piece to complete the operational and valuation analysis is the ROIC comparison*.
The picture supports the previous analysis. LYV is not only largely inferior to Eventim and Netflix, it is moving in the wrong direction. Recent capex to secure new locations has not been value creative yet. TKO’s ROIC is heavily impacted by the UFC acquisition and corporate restructuring, while MSGE is a low performer in this entertainment peer group.
Cash conversion and EPS do not support LYV’s current valuation either. LYV trades at roughly 40x trailing free cash flow, taking float adjusted EV over the company’s own adjusted FCF definition. On FY2025 GAAP free cash flow, which charges the full capex bill of the venue expansion, the multiple climbs above 130x. Reported EPS offers no support. It is negative on a trailing basis, dragged down by the $450M legal accrual and non-cash accretion charges on noncontrolling interests rather than by operating losses.
The full ROIC build, the float-adjusted EV bridge and the peer comparability workbook sit behind this piece. Subscribe to my free FVI package and I will share the detailed valuation models.
Valuing the Gap
On that basis of the analysis above I see LYV as overvalued. In order to evaluate the gap, I chose two approaches.
Sum of the Parts - SOTP
Since LYV runs segments with very different economics, it is a good candidate for a sum of the parts valuation. The ticketing business compares best with Eventim, which derives 80% of its operating profit from ticketing. The concerts and sponsorship business are best valued together as a live event business. To value that part of the business I chose companies. Two of them are leaders in the live event space and drawn from the previous analysis (MSGE and TKO) but not fully comparable (MSGE is a single-market venue operator and TKO generates a significant part of revenue through media rights and licensing deals). I added a third UK based player, Superstruct Entertainment, that is more closely comparable being solely active in the music festival business. However the multiple available goes back to the acquisition by the KKR back in 2024. This provides a more realistic and robust field to value the LYV activity.
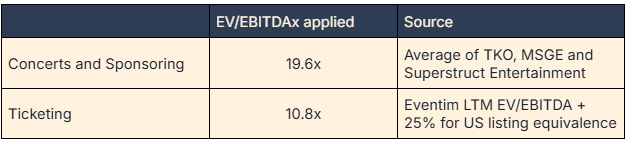
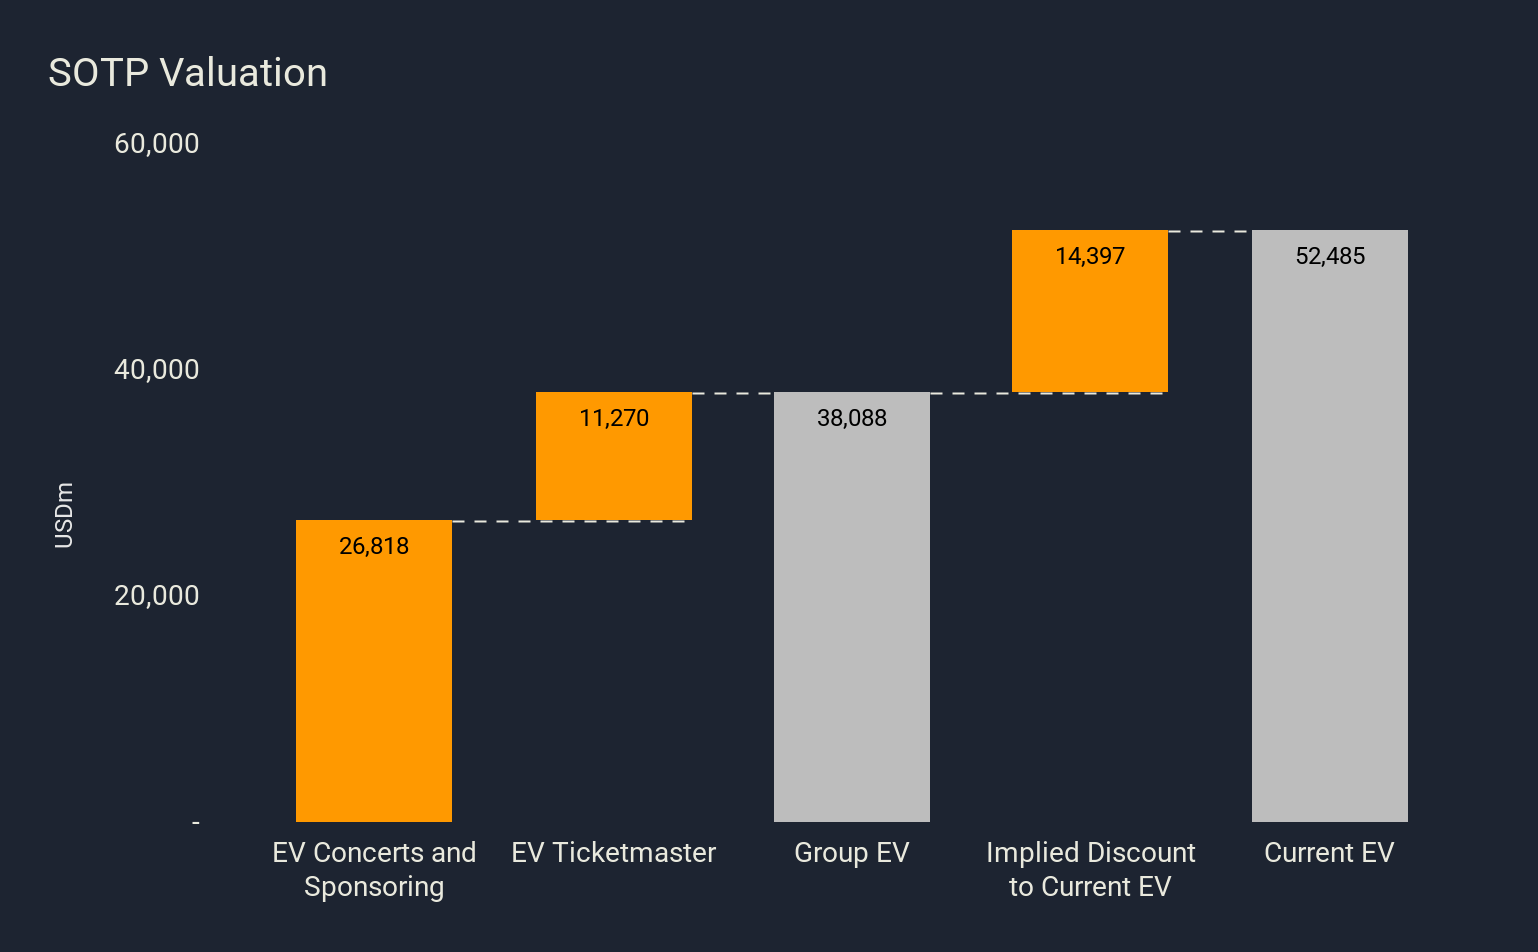
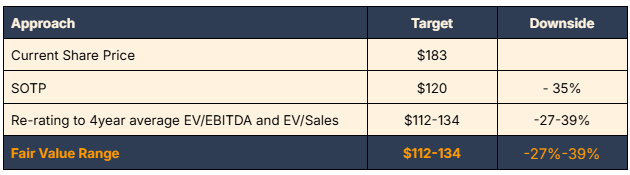
produces a group EV of $38.1bn against a current float-adjusted EV of $52.5bn. That implies the current EV price carries a 27.4% premium over SOTP on an EV basis, which translates to roughly 35% downside at the equity level, a target near $120. This is an anchor for meaningful downside re-rating potential, before even factoring in the DOJ remedies.
Re-rating to hist. average valuation
Since growth and margins have been relatively stable over the past 4 years, I also re-value the business based on its historical average multiples. Re-rating EV/EBITDA and EV/Sales to their 4 year averages drops the share price to the $112-134 range. The SOTP anchor of $120 sits in the middle of that range, so both approaches, built from entirely different inputs, point to the same fair value.
Valuation Range
The litigation tips the balance
The final point, not yet taken into account, tips the balance further. In April 2026 a jury found Live Nation liable for monopolisation and related antitrust violations. The finding centres on Ticketmaster, the group’s segment that generates 43% of total operating profit. Liability is settled. What remains is the remedies phase, where the judge decides between behavioural conditions and a structural breakup. Either way the outcome is negative for the group. The only question is the degree.
Here is where the fundamental case and the event case meet. The valuation work above already puts fair value below the current price without any litigation input. The remedies phase then sits on top of that as a dated catalyst, with an answer expected within the trade window. The market is treating a live breakup risk as close to settled in Live Nation’s favour, pricing the stock near its all-time high three months after a unanimous liability verdict. That is the mispricing.
This is what turns a valuation gap into a trade. A stock that is already overvalued on fundamentals, carrying a binary regulatory event the market has largely priced out, with a decision due inside the holding window, is a negative value gap with a catalyst attached. The defined-risk way to express it is a downward options spread, which caps the cost if the mild outcome lands and the stock re-rates higher, while capturing the gap if the remedy bites. The structure, strikes and timing come in Part II, next week.
Part II covers the trade itself: timing evaluation, catalysts, options strategy. FVI members get the full trade construction, trading alerts for short-listed value gaps and follow-up on live trades. Join the community now to learn how to trade value gaps with options.