
Two Kings changing their throne?
Why Netflix and Spotify move so closely, and what it tells me about a potential value gap for Netflix

The thesis in summary
Netflix is down 40% over 12 months despite double digit revenue growth and a record 32.3% operating margin in Q1 2026. Valuation sits at the lowest level in the company’s history.
The decline is not Netflix specific. Spotify followed the same 40-45% trajectory. The market has re-rated both names from growth stocks to maturity cash generators, which typically compresses multiples.
Within that re-rating, Spotify trades at roughly a 20% premium to Netflix on earnings. Netflix has the stronger business on every operational measure: 49% gross margin against Spotify’s 32%, ARPU of $12.1 against $5.4, and a position as both content aggregator and IP creator while Spotify only distributes third party content. The premium runs the wrong way round.
Reverse DCF suggests a potential upside of around 20% but that requires the market to revise its narrative. A strong Q2 or Q3 could deliver that. PEG comparison with other large caps shows an immediate re-rating without a catalyst does not seem warranted.
The asymmetry is favourable. Downside is largely already in the price after the 40% drop. Upside depends on whether the ads business doubling to $3 billion in 2026, and live event monetisation, deliver as management has guided.
The barrier to a trade is catalyst visibility, not value. Netflix stopped disclosing subscriber and ARM detail from Q1 2025, so the only confirmation points for the ads and live thesis are the quarterly prints. Q2 in July and Q3 in October are the windows.
Conclusion: this is not a clear case of a value gap, it is more a long term value play with downside largely absorbed. What is missing is a catalyst to close it within the 6-12 month window I would normally trade. The next two earnings prints (Q2 in July, Q3 in October) are the test. Ads tracking the doubling-to-$3 billion guide, and engagement on the live events, are the two signals I am watching. Until then, Netflix sits on the watchlist.
Reaching a growth ceiling?
The main narrative for multiple compression of Netflix and Spotify is that the market view has changed and sees both players as transitioning from growth stage to maturity stage. The second typically commands lower valuation multiples.
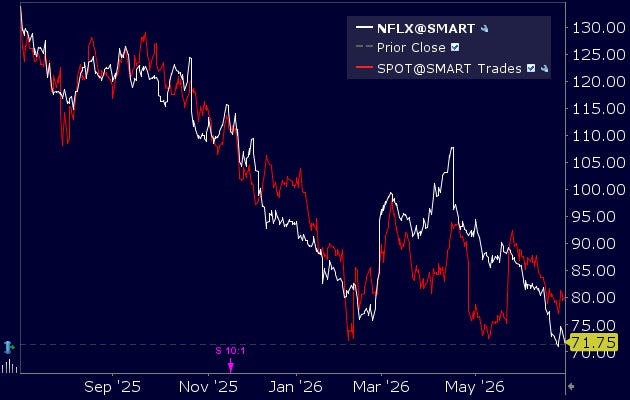
With 325 million subscribers and a dominant market position, additional subscriber growth is still there to capture but more limited in a market estimated at around 700 million potential subscribers, with competition consolidating.
The remaining headroom is also in countries with lower subscription fees, which caps the topline contribution of incremental subscribers.
Scale effects should still support margin expansion as the subscriber base grows, but two factors push the other way: live events carry higher cost per viewing hour, and Netflix does not have a large legacy title library to amortise across viewers in the way the traditional studios do.
Spotify is in a similar position with a dominant market share of more than 30%. Volume growth seems limited and focus is on margin, where cost management and negotiated royalty fee will show if further margin can be carved out.
From cash poor to cash rich
The second argument for the transition from growth to value is cash generation. Both companies have moved from cash burn to high conversion in the space of three years.
Netflix free cash flow has gone from $1.6 billion in 2022 to $11.9 billion on a trailing twelve month basis. Spotify has moved from €21 million in 2022 to €3.2 billion LTM. Management has guided FY2026 Netflix free cash flow to around $11 billion. With share buybacks running in the multiple billions per year, Netflix can now legitimately be valued on cash returned to investors, not on subscriber growth alone. That is the maturity narrative the market is pricing.
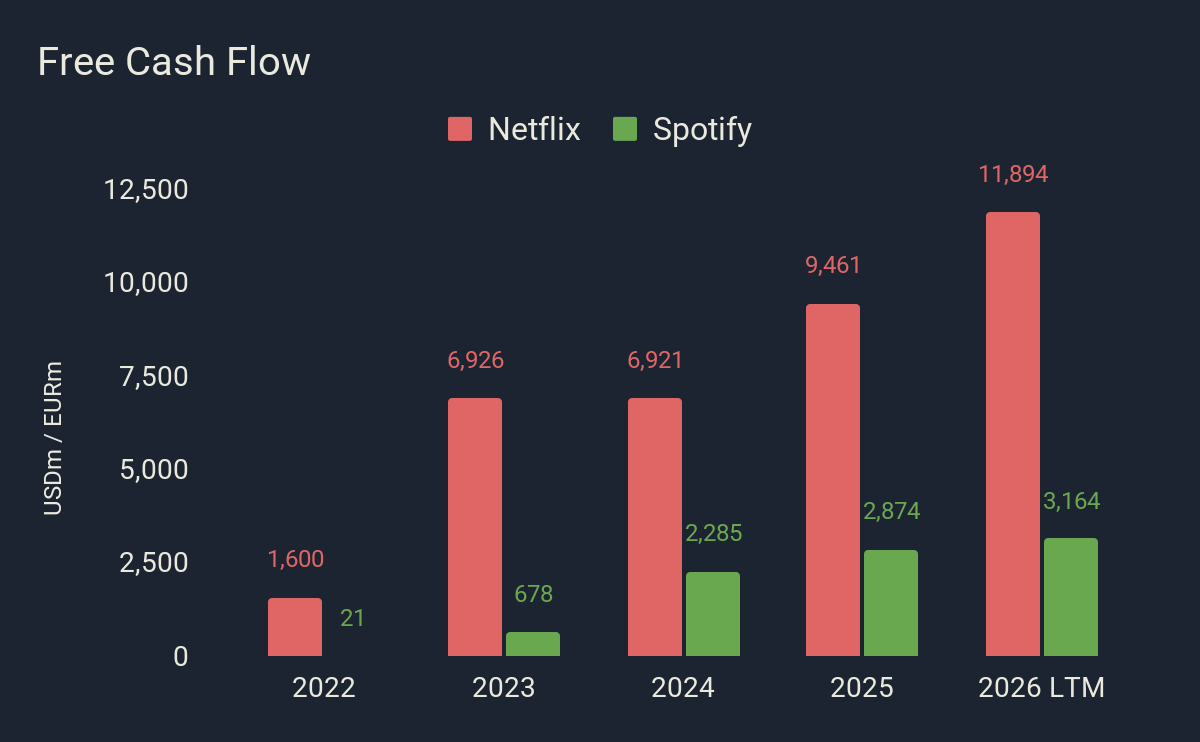
Considering the deep penetration globally of Netflix, it is reasonable to see the volume ceiling as close. To understand that in detail, the next sections work through Netflix’s strategy on price, ads and live events.
For me the question is not whether Netflix has long term value as a cash flow driven business. The question is whether there is a mispricing today, and whether the next 6-12 months have a catalyst strong enough to deliver a 15-20% share price move that narrows the gap.
To answer that I look at two aspects:
1. Whether the current discount vs. Spotify is justified given the difference in business structure and operating performance.
2. Whether Netflix looks fairly valued against peers and against its own implied growth expectations.
Two industry leaders, different positions
Both are clear leaders in their markets with a similar total number of paid users. They are also both pure play subscription businesses, which is why they are the best pair to compare.
Their positions in the value chain are not the same and that difference matters when assessing business quality.
Both are content aggregators, one in video entertainment, the other in music. Netflix is also a major IP creator, which means it taps into the largest profit pool in the value chain. Spotify only distributes third party content.
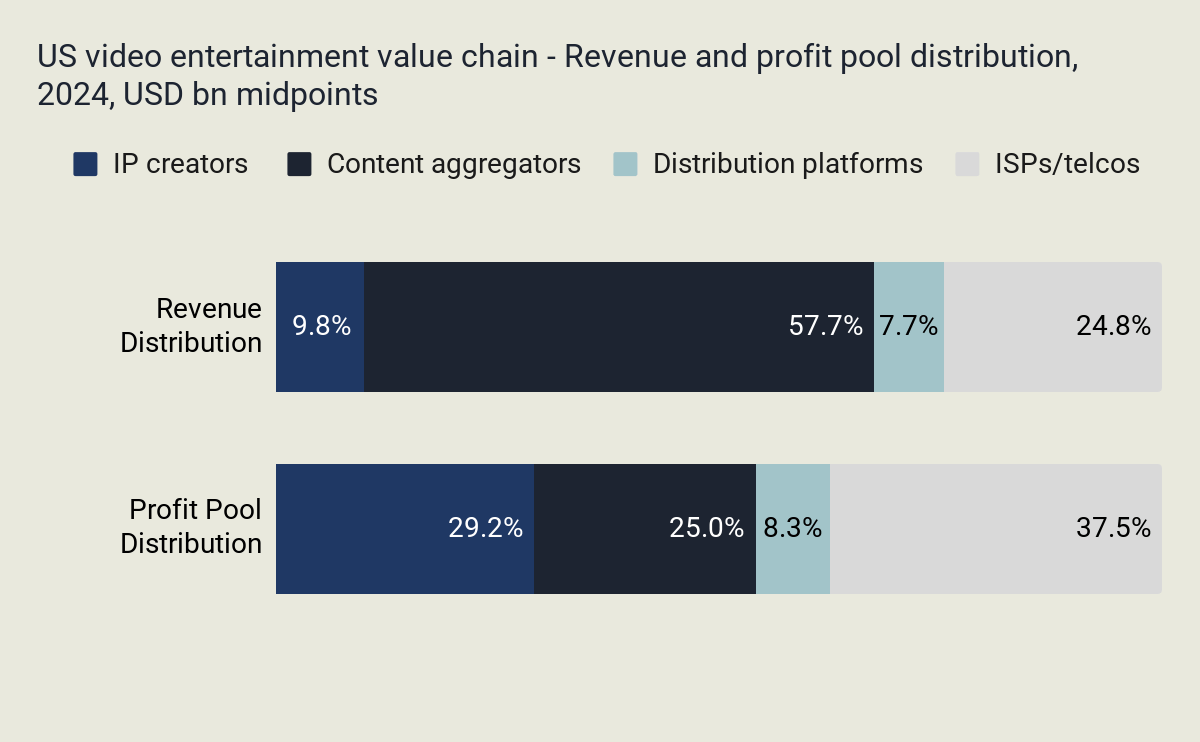
This difference explains the gap in gross profit margin between the two companies (49% vs 32% in Q1 2026) and the gap in pricing power. Netflix’s ARPU of $12.1 against Spotify’s $5.4 is the consequence, not the cause.
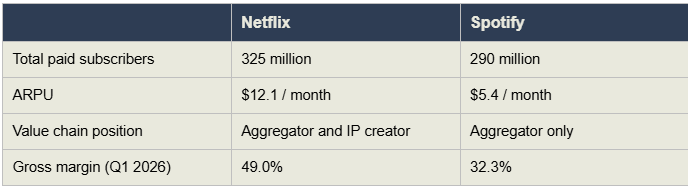
On business quality, Netflix has a clear edge. Multiples, of course, are not driven by current quality alone, they are driven by how things are expected to change.
The new growth edge
Netflix has been raising prices in the US and several other markets to grow topline without material subscriber attrition. That speaks to pricing power. With consumer spending tighter, management has been pushing additional levers as well.
Before getting into them, a short note on the economics by content type. Netflix does not disclose unit economics directly, but the picture is clear from filings and the earnings call:
1. Off the shelf movies and series. Netflix pays royalties to broadcast legacy content. Cheapest cost per view because rights are typically inexpensive and the content has long lasting view potential.
2. Own content created through series and films. Higher upfront cost, amortised across the global subscriber base.
3. Live events. A newer category. Higher cost per viewing hour and more volatile than traditional content.
Live content has been growing fast, in particular sports (boxing, NFL Christmas Day games, MLB opening night, WBC) and event programming (Skyscraper Live, BTS comeback concert).
Live content attracts users who want a specific event, but the larger commercial case is the advertising revenue these events generate. Rights costs are high and lumpy, so the relevant metric is content amortisation against the engagement and ad revenue they pull in, not cost per viewing hour in isolation.
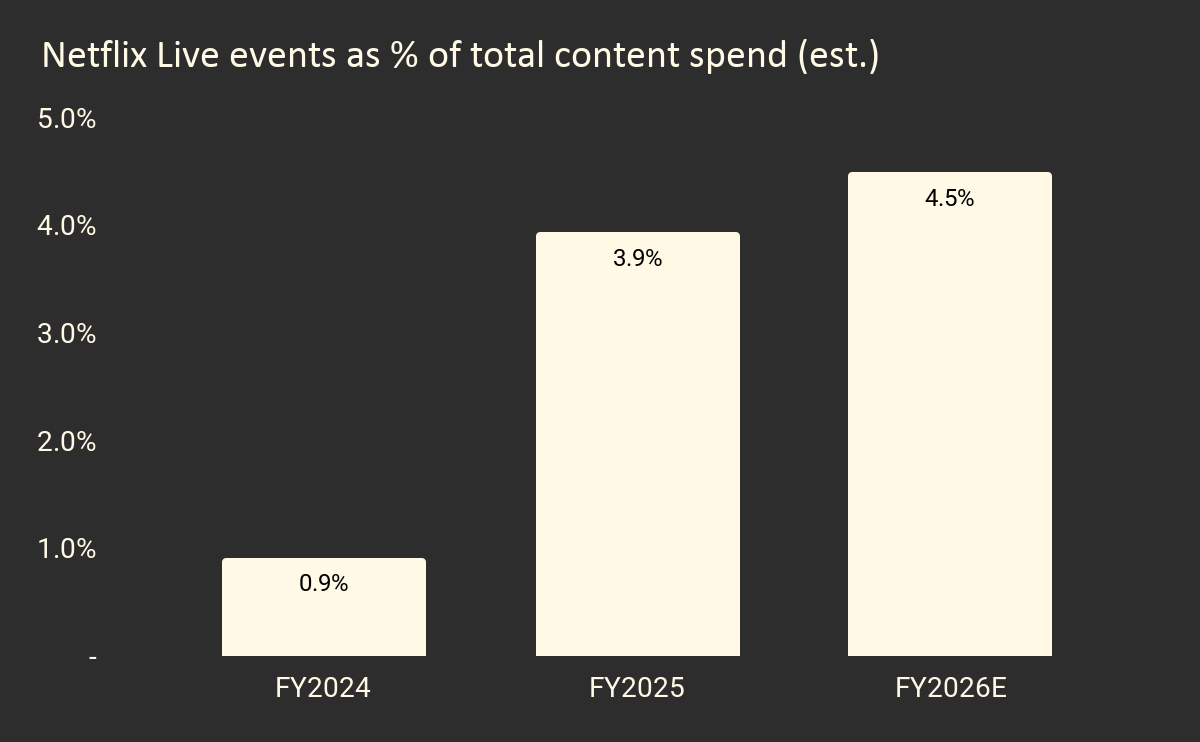
Live spend as a share of total content spend has grown from roughly 1% in 2024 to around 4% in 2025 and an estimated 4.5% in 2026. Whether this is margin accretive in aggregate is not visible from public disclosure. Management framed live as part of the broader event strategy and emphasised discipline on rights pricing. The proof point will be the ads revenue line.
The second new lever is advertising. About 15 countries now offer an ad-supported plan at roughly half the price of the standard plan. The bet is that incremental ad revenue exceeds the lost subscription revenue. Management has guided FY2026 ad revenue to roughly double to $3 billion. If that holds, I would expect standard plan prices to keep rising, partly to migrate more subscribers into the ad tier where Netflix can monetise the user twice. Paramount, Disney and the other major streamers are running the same playbook.
Spotify faces the same subscriber ceiling but without Netflix’s pricing leverage, so its growth playbook has to work around the royalty structure rather than through it.
Music royalties are calculated as a percentage of revenue, so roughly two thirds of every subscription price increase flows back to labels and publishers. For Netflix, a price increase drops largely to the margin line. For Spotify, rights holders recapture most of it automatically. Spotify’s consolidated gross margin has moved from 26% in 2023 to 32% in 2025. The direction is right but the ceiling is low against Netflix’s 49%, and the pace is slow.
The levers Spotify is pulling sit around that royalty structure: audiobooks (consumption-based royalties), podcasts (monetised via Spotify Audience Network with no music royalty drag), advertising on the free tier (gross margin still thin at 13% in Q1 2026 but improving from near zero in 2022), and a two-sided creator marketplace. Each is structurally higher margin than music streaming, but each is small relative to the core today.
The trajectory is positive, the pace is modest, and the structural gap to Netflix on pricing leverage and margin expansion remains wide.
Overall, I still give Netflix the edge on future growth and margin expansion. The valuation gap between the two is not justified by the operational data. Whether the gap closes by Netflix moving up or Spotify moving down, I cannot tell without taking a view on the broader market multiple regime.
What I can do is run a reverse DCF on Netflix. With cash generation now stable and predictable, the implied long term growth rate is a meaningful number, not a torture of assumptions.
Valuation
Using reverse DCF analysis
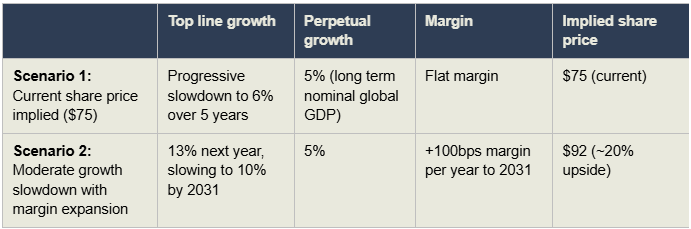
At the current share price, the market is pricing Netflix on a long term cash flow growth rate of around 5%, in line with the long term nominal global GDP estimate. That is a sensible base case for a business of this size with a near saturated subscriber profile. A more optimistic case, in line with recent performance (13% next year decelerating to 10% by 2031, with 100 basis points of operating margin expansion per year) gets to roughly $92 per share, around 20% above the current price. Achieving that requires the growth story to continue and a successful expansion in live events and towards more ads revenue to boost margin. A strong Q2 or Q3 could re-rate towards scenario 2.
My reverse DCF model (with sensitivities on WACC, capex and tax) is shared with the community. Join Flow Value Investing to access it.
Multiple re-rating
The reverse DCF frames the upside. The question is whether the market’s current multiple already reflects that potential, or whether there is room for re-rating. To test that I look at PEG ratios across comparable businesses.
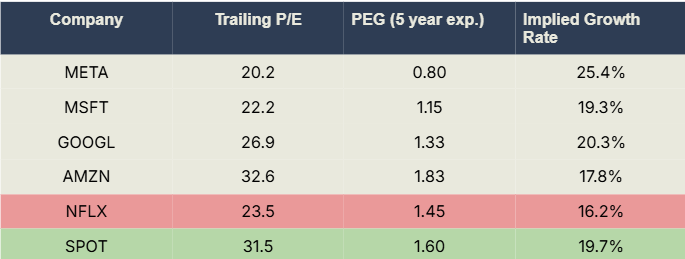
At a current share price of around $75, Netflix trades at ~24x with a normalised EPS of $3.16, PEG ratio of 1.45 on a 5 year expected growth basis. The multiple is consistent with the market pricing meaningful growth deceleration, which is a fair concern for any business at this scale.
The Q1 2026 print suggests the deceleration priced in is more severe than the fundamentals support. Revenue grew 16% year on year, operating margin hit a record 32.3%, and the structural growth drivers (ad-tier monetisation in early innings, 2-4% annual ARM expansion, underpenetrated emerging markets, and management’s own guide of 12-14% revenue growth and 31.5% operating margin for 2026) support 12-15% revenue growth over the next three to four years. On that basis, the operational case for a higher multiple is there.
The peer comparison tempers that. Comparable tech businesses with 30%+ operating margins, strong FCF conversion, and global scale currently trade at 0.8-1.8x PEG. Netflix sits right in the middle of that range. The market is pricing it as a quality compounder, which it is. A re-rating from here requires the growth drivers to show up in reported numbers, not just in the forward outlook.
Catalysts and trade decision
The reverse DCF and PEG comparison point in the same direction. Netflix is not obviously mispriced against peers, but it is priced for a growth trajectory that understates recent performance and the structural tailwinds from ads and live events. The gap between what the market is pricing (5% perpetuity growth) and what the business is currently delivering (16% revenue growth, 32.3% operating margin) leaves room for a re-rating if execution continues.
The barrier is catalyst visibility. Netflix stopped disclosing subscriber and ARM detail from Q1 2025, so the only confirmation points for the ads and live thesis are the quarterly prints. Ad revenue tracking the doubling-to-$3 billion guide, and engagement metrics on live events, are the two signals that would shift the narrative.
Q2 in July and Q3 in October are the windows. A strong print on either, particularly one that confirms ad monetisation is scaling, could trigger a move towards the $92 scenario. Until that confirmation arrives, the setup is a long term value play with downside largely absorbed, rather than a clearly catalysed trade within my usual 6-12 month window. Netflix sits on the watchlist.
Follow my watchlist and live trade signals at FlowValueInvesting.